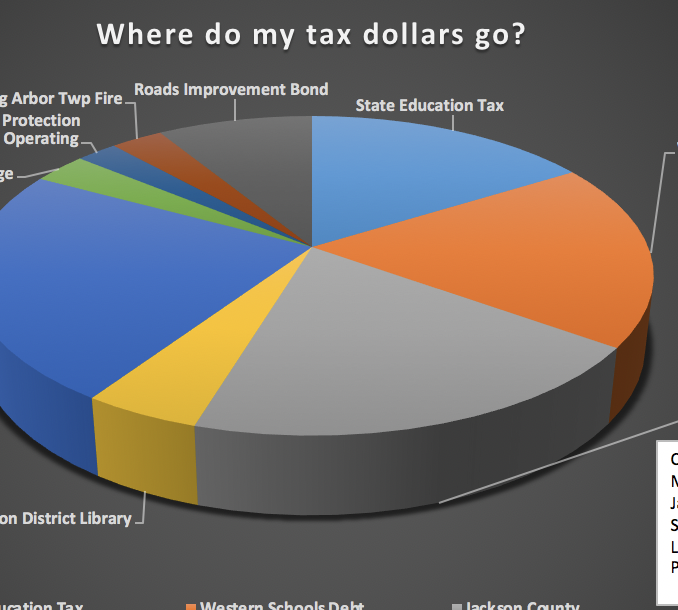
This post accompanies the winter 2020 newsletter and answers the question: Where does all that tax money go and why so much? Attached is a breakdown and pie chart that shows “where the money” ends up. This is based on a market value of 100,000.00 and taxable value of 50,000.00
Download Pie Chart